Up the workers
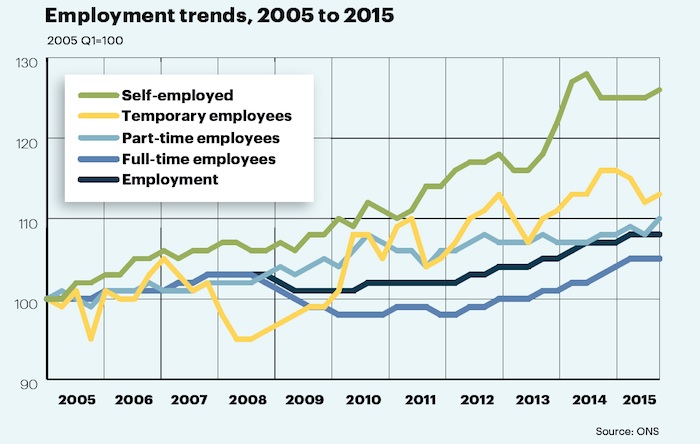
Figures from the Office for National Statistics reveal how employment patterns have shifted over the past decade. Levels of full-time employment have recovered from the battering inflicted by the downturn and now stand higher than the pre-recession peak, but the most marked change is the increase in self-employment, which reached 4.6 million people in the 2013-14 tax year.
Note that the self-employed line includes all varieties of working hours. The dedicated part-time trend line, for example, relates only to employees working part-time. Also note that temporary employees can work full- or part-time and are counted in each applicable line.
Save yourself
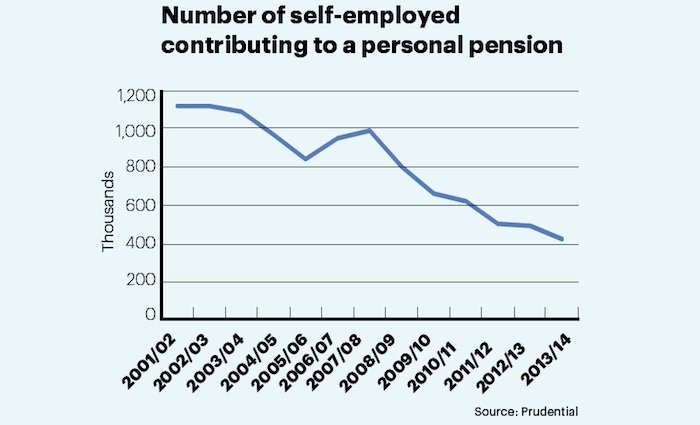
Pensions provider Prudential has crunched numbers from HMRC and ONS to assess the future prospects of the nation’s self-employed. Even as self-employment has been rising over the past decade, the number paying into a personal pension has been trailing away. The proportion contributing to a retirement fund has fallen from over a third in 2001 to now stand at 9%, or about 1 in 11 self-employed people.
The figures suggest that most self-employed people are finding it increasingly hard to generate enough income to save for the future, a notion corroborated by Prudential research from 2014. There is, alas, no equivalent of auto-enrolment for the self-employed though there is tax relief on contributions.
Problems loom not just for the individuals involved but for taxpayers. Costs will surely arise either via future welfare provision or through increased incentives to encourage the self-employed to get saving.
Ups and downs
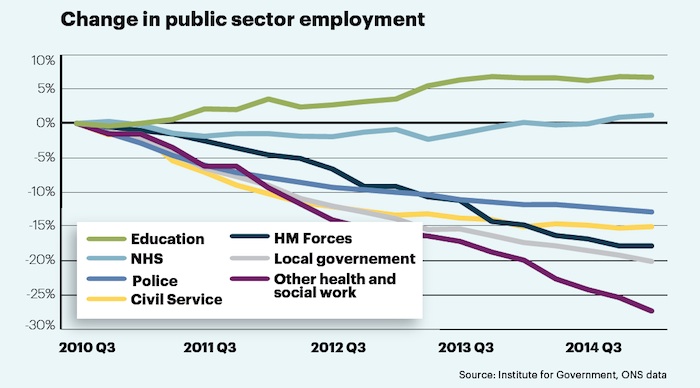
Public sector cuts over the past five years have triggered some dramatic drops in headcount across the public sector, with local government hit particularly hard in percentage terms, down by a fifth. Within local government, non-NHS health and social work employment has fallen by more than a quarter. NHS and education employment, by contrast, has been rising recently.
As of March 2015, when the most recent numbers were collected, local government employed the equivalent 1.7 million full time posts, the NHS 1.4 million, education 1.1 million and the civil service 0.4 million.
Altruism versus jingoism
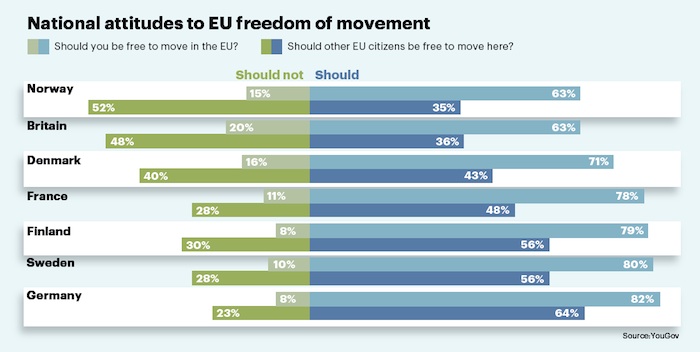
YouGov recently asked two separate samples of people essentially the same question, but posed from opposite ends of the telescope.
One group was asked whether citizens of their own country should be able to live and work wherever they please within the EU. Unsurprisingly, the majority of people felt that they and their fellow citizens should continue to enjoy this freedom.
The second group were asked the corollary: should citizens of other EU nations be free to come to your country as a place to live and work? The results this time around were markedly more cautious.
Respondents in Norway and Britain produced the biggest disparity between the warm welcome expected abroad versus the cold shoulder offered to foreigners.
Stay at home surplus
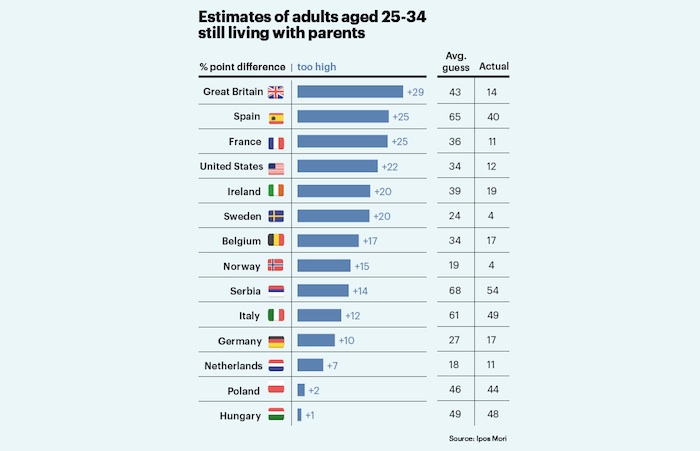
Britain’s housing problems may be bad, but they are not as bad as most Britons think they are. Asked what proportion of adults aged 25-34 are still living with their parents, the British public guessed at 43%. The reality is a markedly less coddled 14%.
This misconception is culled from Ipsos Mori’s Perils of Perception survey, which plumbs the gulf between facts and thoughts among citizens in 33 nations. The above question is one where Britain leads the world in being way out of whack.
In most other topics, Britain puts in a midfield appearance – with public opinion simply being unfamiliar with the facts, rather than in a different postcode. We think the average Briton is 51 years old, when the average age is 40, probably because of worries about an ageing society. And yet simultaneously we manage to believe that 27% of the population is under 14, when the real figure is 17%, no doubt due to concerns about childcare and school places.
At least we are not as muddled as the Japanese, who conjured up the biggest disparity in the survey. Asked how many of their compatriots live in a rural setting, they plumped for 56%, when the actual figure is about 7%. Being out by almost half the population is a pretty big margin for error.
Sample skew
YouGov has published a post-mortem examination of its general election polling, which along with rivals predicted a hung parliament and not the Conservative victory that actually unfolded.
The pollster’s rake through the ashes found no evidence of so-called shy Tories, reluctant to admit their intention to vote blue. However, it did uncover errors and invalid assumptions in sample selection. For example, newspaper readership was used as indicator of political engagement and thus likelihood of voting, a chain of logic with an obvious flaw given today’s digital media.
YouGov also thinks it made mistakes in sample selection. People aged 18-24 with a keen interest in politics, who as a group tend to support Labour, were over-represented by a factor of four, YouGov now estimates. People over 65, who are very likely to vote – and to vote Tory – were similarly under-represented in the pre-election polls. Together, flaws in age distribution and political interest account for two thirds of the discrepancy between the polls and the outcome. An increasing reluctance to participate in polls may explain the rest.
With local and devolved elections due this May, it will soon become clear if the pollsters have managed to put their spreadsheets back in order.


