The fourth set of UK Whole of Government Accounts (WGA), covering 2013/14, was published on 26 March 2015 but received limited external coverage. Surprising really, as the WGA provides a consolidated position for the UK central government (including health bodies), local government and public corporations. As such, it is a world first. Combined with arguably the most developed government financial reporting framework in the world, the WGA is a powerful tool to help understand historic UK government finances and aid decision-making with respect to future UK government finances. Instead the vast majority of fiscal analysis and debate is based on economic and statistical frameworks, rather than on accounting principles.
The WGA is detailed, running to 233 pages. Being published 12 months after year-end might be seen as limiting its use, however, we do now have four years of trend information providing very relevant insights on matters such as government debt, asset management, liabilities, the nature of government expenditure, the boundary of government – in summary, matters that are central to the government’s fiscal programme.
Focusing on the historic measurement of government debt for example, the WGA contains a reconciliation between the WGA balance sheet and the Public Sector Net Debt position. According to the National Accounts – the standard statistical framework for measuring the economy used across the European Union and United Nations – the PSND was £1,402bn at March 31, 2014. The equivalent figure per the WGA reconciliation is £1,852bn, being the net liability position for UK government at the bottom of the statement of financial position (balance sheet). As the WGA is constructed under accounting principles, the net liability includes the £795bn worth of the government’s tangible and intangible assets and £1,302bn of public service pension liabilities. None of these are recognised in the National Accounts measure. There are also reconciling items with respect to provisions, investments, Private Finance Initiative liabilities plus others issues flagged in the National Audit Office’s qualified audit report. So historic reporting under WGA looks different, and is arguably more complete than under the economic and statistical framework.
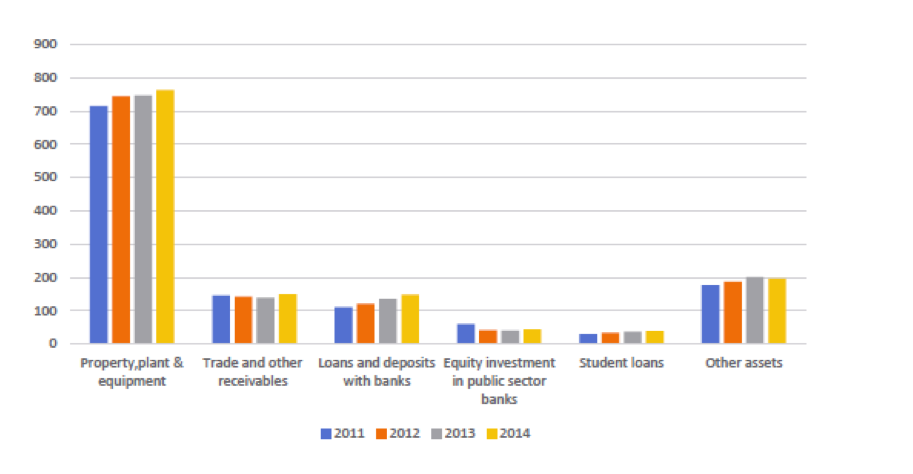
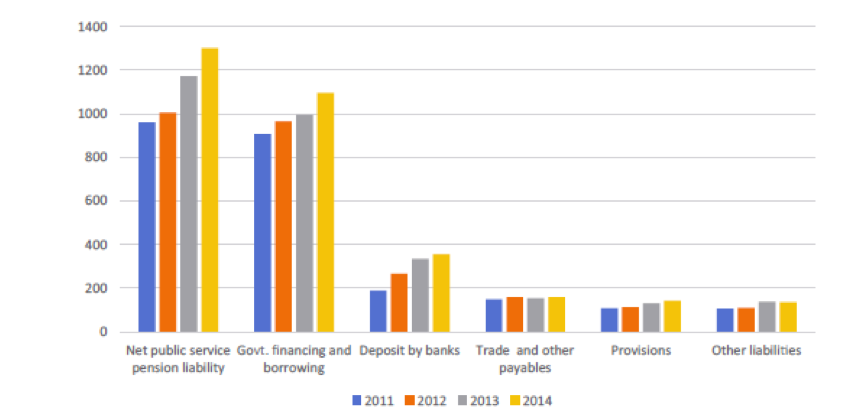
We do now have four years of trend analysis for WGA and to accompany WGA, HM Treasury produce a very useful “key facts and figures” summary from which the graphs below have been extracted. It is the case that across the period 2010/11 to 2013/14 significant work has been undertaken to refine the way that the WGA are put together, including pulling in a number of additional public service entities. Therefore any trend analysis needs to be caveated. However, I set out below some high-level observations:
• The balance sheet shows that the property, plant and equipment held has grown from £714bn to £762bn in the 4-year period to 31 March 2014. Part of this increase may have been caused by revaluations, but in the context of a diminishing public service workforce and a drive to dispose of assets this growth is a surprise;

• The liability associated with public sector pensions has grown from £961bn as at 31 March 2011 to £1,302bn as at 31 March 2014. An assumption is that this is a result of actuarial changes and potentially the impact of reducing the size of the public service workforce. However, this would seem to be an increase worthy of further consideration;
• Government borrowing in the period has grown by £188bn to £1,096bn as at 31 March 2014. In addition, the financial liabilities, which I understand relate to the cash management operation (quantitative easing) and IMF loans, have grown from £295bn to £491bn at 31 March 2014;

• The net result of these changes is that the net liabilities reported under WGA have grown from £1,186bn (or 75% of GDP) to £1,852bn (or 111% of GDP) as at 31 March 2014;
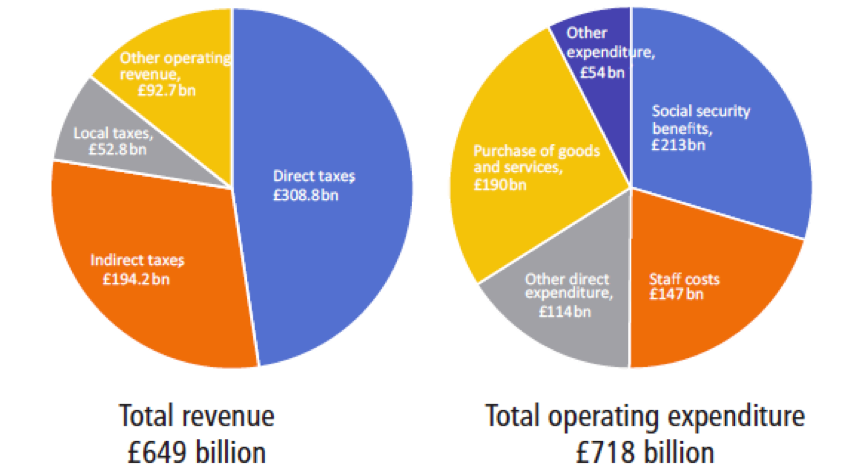
• The revenue and expenditure summaries show that total revenue has grown from £614bn to £649bn with direct expenditure (before depreciation and revaluations) staying flat at around £660bn per annum. This suggests that, before considering the average £36bn a year of depreciation and revaluations, revenue comes close to covering expenditure. (See below pie charts breaking down 2013/14 revenue and expenditure, with the depreciation and revaluations shown as the £54bn of other expenditure);

• The other cost not shown in this statement is the circa £34bn of financing costs associated with government debt;
• Given that fiscal decision-making is taken on the basis of economic and statistical frameworks it might be naïve to try to overlay an accounting analysis on the above. However, it does look like much of the £666bn increase in government’s net liabilities is the result of the financing costs associated with government debt and the balance sheet movements as opposed to the revenue and expenditure position.
In terms of next steps, more should be made of the WGA and accounting tools in decision-making. As demonstrated above, there is a wealth of analysis that can be drawn from WGA and this does look different from that drawn from the economic and statistical frameworks. There is a key point around the timeliness of the accounts. Closing the accounts earlier would demand considerably more resources and is likely to require interim financial statements, or at least a hard close of the accounts at the interim stage, and accelerated deadlines for the individual entities consolidated in the WGA.
There is also an opportunity to build in flexibility in the way that the WGA consolidation is constructed in order to respond to the devolution agenda. For example, it would have been useful to be able to produce a set of Scottish WGA at the time of the independence referendum, acknowledging that CIPFA was able to present an alternative analysis. Likewise, having a set of WGA covering the Northern Powerhouse would aid the policy context and decision-making.


