Next month the government will set out its plans for public service spending through to 2020. The indications are that the plans will be a rerun of the 2010 Spending Review. The overall aim – as in 2010 –will be to eliminate the public spending deficit and reduce government debt as a proportion of GDP. Once again, large (25–40 per cent) real cuts are expected for most departments. And, as in 2010, NHS spending will be protected.
But the protection is relative and the decade since the 2010 Spending Review will be the toughest financially since the inception of the NHS.
Looking at the NHS across the whole of the United Kingdom allows analysis of spending as a share of national wealth as measured by GDP. It also makes it easier to make comparisons with other countries’ spending.
Over the past parliament the annual average real increase in UK NHS spending was 0.84 per cent (Figure 1). This is the smallest increase in spending for any political party’s period in office since the second world war and amounts to around a quarter of the long-run average increase in funding since 1951.
While next month’s Spending Review will reveal the actual size of the real cuts most of Whitehall has been modelling, we already know more or less what the NHS will get. For the NHS in England (around 83 per cent of the UK NHS in spending terms) the government has made it clear that spending will rise by £8 billion by 2020/21 – although it remains unclear how this increase will be phased. (The oft quoted increase of £10 billion includes the real increase in this year’s budget).
It will be for Scotland, Wales and Northern Ireland to decide spending on their health services, but assuming they increase their health budgets in line with England’s then the increase in real spending to 2020/21 could average almost 1.75 per cent per year. This is twice the average over the last Spending Review period, but still the lowest of any parties’ time in office and less than half the long-run average.
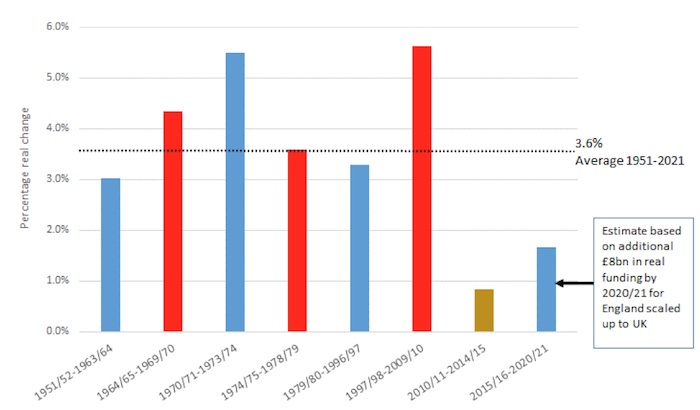
Fig 1: Real annual average changes in UK NHS spending by governing party: 1951–2020
Cutting up historic and planned spending by decade emphasises the scale of the funding squeeze historically (Figure 2). On current plans and assumptions, real spending between 2010/11 and 2020/21 will increase by just 1.3 per cent per year on average compared to the long-run average of 3.6 per cent.
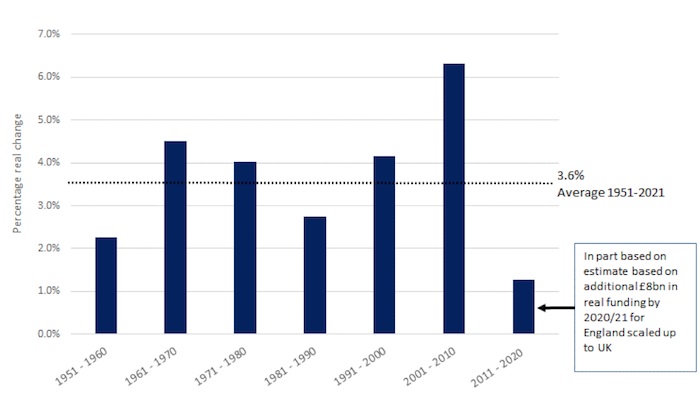
Fig 2: Real annual average changes in UK NHS spending by decade: 1951–2020
Although health spending will grow, growth in the economy as a whole will almost certainly outstrip the relatively small real-terms increase pencilled in for the NHS. Between 2009/10 and 2020/21 the UK GDP is forecast to increase in real terms by more than a quarter. But NHS spending across the United Kingdom will have risen by around 15 per cent.
As Figure 3 shows, the ten years up to 2020/21 are likely to see the largest sustained fall in NHS spending as a share of GDP in any period since 1951. Even as the ‘cake’ is growing, we will devote a smaller slice of it to health care. The reduction of around 0.7 percentage points of GDP would take spending as a share of GDP back to the level in 2008/9 and represent a loss of around £14 billion in today’s prices.
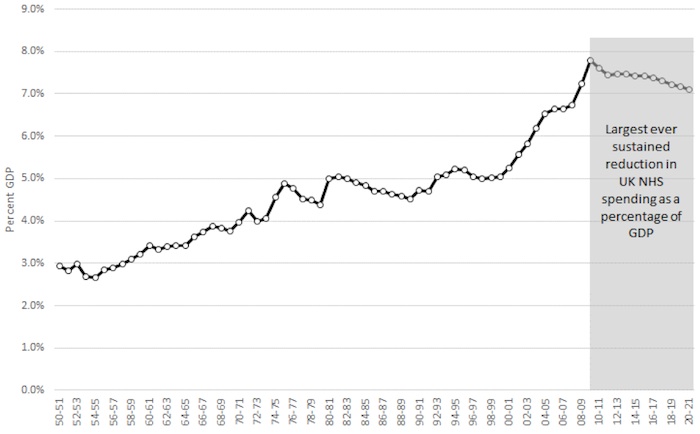
Fig 3: UK NHS spending as a percentage of GDP: 1951–2021
Internationally too, health care spending in the United Kingdom as a share of GDP is slipping backwards. Although UK health care spending rose in real terms between 2009 and 2013, the economy expanded faster – reducing health care’s share of GDP. Compared to others, the United Kingdom has slipped further into the bottom half of the Organisation for Economic Co-operation and Development (OECD) health spending league – overtaken by Finland and Slovenia (Figure 4).
It is clear from both the historical record and international comparisons that health spending in the United Kingdom could hardly be considered profligate – yet it is now set to reduce further as a share of our expanding national wealth.
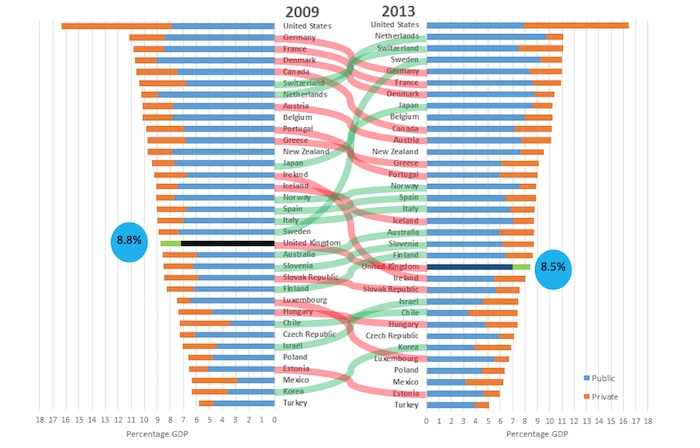
Fig 4: Change in total health spend as a proportion of GDP: OECD countries, 2009 and 2013
Once again the challenge for the NHS will be to squeeze more health care out of every pound. But as our QMR survey to be published this week will once again show, the overwhelming majority of NHS finance directors are sceptical about chances of the NHS delivering the required productivity gains over the next five years. And forecasts of providers overspending this year by more than £2 billion in England suggest the NHS has reached the end of the productivity road in the short-term.
The huge overspend NHS providers recorded in the first quarter of this year was due neither to a lack of reform nor a reluctance to reduce waste and improve productivity. Increases in spending are increasingly falling behind increases in demand and costs, as well as the NHS’s ability in the short term at least to make ends meet through productivity improvements. As a result the NHS is struggling to meet its obligations to patients. Headline waiting times standards for cancer and in emergency departments, for example, are now missed routinely, the target minimum wait for diagnostic tests has not been met for the past 18 months, and though now abandoned, the admitted elective waiting time target was missed in 14 of the past 18 months.
If this is the situation as we come to the end of the 2010 Spending Review period, what will be the position in another five years?
This article was first published via The King’s Fund blog.


