Male staff in local bodies earn 7.7% more

Local authorities in England pay men 7.7% more than women on average, according to CIPFA analysis of the gender pay gap data available on the government’s website.
Since 6 April this year, all employers with 250 or more employees have been required to calculate and publish their mean and median gender pay gaps – the difference in the average hourly wage of all men and women across a workforce.
Alongside this, they are required to publish data on bonuses, while public sector employers must also publish the proportions of male and female full-time equivalent staff in the lower, lower middle, upper middle and upper quartile pay bands.
CIPFA’s analysis of this reported data shows that police authorities and counties have the largest median gender pay gaps at 18.7% and 13.6% respectively, while London boroughs have the lowest at 1.9% (see graph, left). Indeed, almost one third of London councils pay women more on average.
David Caplan, CIPFA’s head of analytics and research, says: “The data shows there is a wide variation in the gender pay gap not only between different types of authorities but also between authorities of the same type.
“Sometimes, these differences result from structural variations as some councils have large numbers of low-paid female workers – perhaps working in social care – and much smaller numbers of low-paid male staff.”
Zero effect: 27 authorities have a gender pay gap of zero

Women out earn men in some London authorities
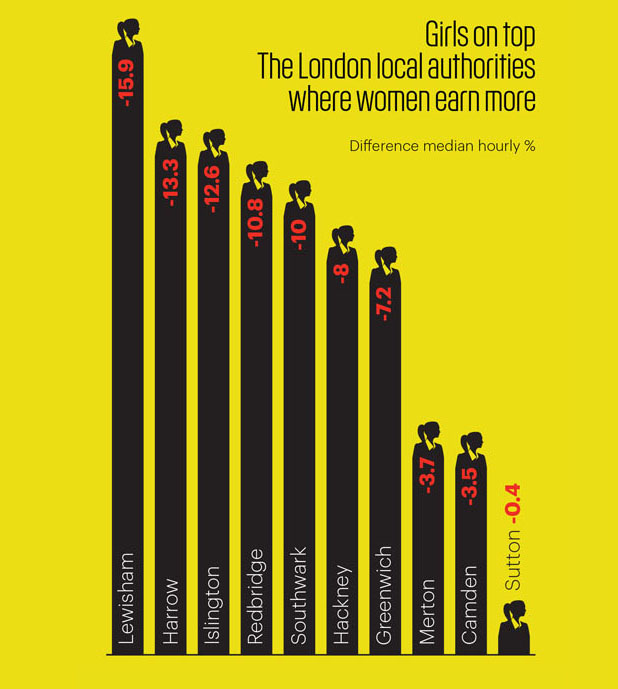
It appears London has a good story to tell – it has one of the lowest median pay gaps in the sector at 1.9%.
Four London boroughs – Barnet, Ealing, Havering and Hillingdon – have a zero gap (see Zero Heroes, above). Ten have a negative pay gap – in other words, one that favours women, reaching -15.9% in the case of Lewisham (see above).
The workforce in the capital’s councils is female dominated in all quartiles. Women hold 56.4% of the most senior roles.
A London Councils spokesperson said: “The capital’s local government workforce has benefited from strong leadership on this issue, from politicians and senior officers. A long-term commitment, effective staff engagement, and encouraging flexible working, have all helped.”
The London borough with the highest gender pay in favour of men is Barking & Dagenham, with a median gap of 13.9%, significantly above the average for both London councils and councils as a whole.
A spokesman told PF the figures were not entirely representative of the council's situation.
“Many public-sector organisations have outsourced services such as cleaning and catering, which are jobs predominantly held by women, skewing the figures. If we were to do the same, our median gap would be 0.3%,” they said.
Going forward, gender pay gap figures would be published on a quarterly basis to measure progress, the spokesperson added.
District council pledges to act after finding men earn a third more

Looking at the authorities with the largest median gender pay gap, North Hertfordshire District Council tops the chart at 34%.
Deputy chief executive Anthony Roche says the council takes the figures very seriously.
“Where we have a gender pay gap in senior management roles, we have plans in place to implement more leadership development and succession planning to support women considering those roles,” he says.
“The council’s gender pay gap can also be explained by the contracting out of services such as waste and recycling and grounds maintenance, jobs predominantly filled by men.”
Most in-house roles are office based and tend to suit flexible working so attract women. “If the contracted out roles were filled in house, the pay gap would be smaller,” he says.
Police and fire
Two police authorities – Derbyshire and Kent – are among the 10 bodies with the largest gaps, reflecting police services’ relatively poor performance. It is notable that in both police and fire authorities, men dominate senior roles, filling 72.2% and 88% of jobs in the upper earnings quartile respectively (see below).
Counties
The data also throws up some interesting findings for county councils (see below). Despite the relatively high overall gap, women occupy two thirds of senior roles (65.5%). However, in the lower earnings quartile, women take almost eight out of 10 jobs.
Jessica Studdert, deputy director of the New Local Government Network, observes: “At the lower end of the earnings distribution, the data is likely to reflect the division of labour, with women occupying many lower-paid positions in social care and education.”
A County Councils Network spokesperson says: “The figures show that we cannot be complacent, and our member authorities must continue the progress they have made.”

Analysis: some weakness but a useful start
Theresa May has hailed the publication of gender pay gap data as a way to tackle a “burning injustice”. But is it the be-all and end-all?
At Unison, head of local government Heather Wakefield agrees that the data reflects “wider patterns of inequality and occupational gender segregation in the local government workforce” but notes that the data fails to capture the complete picture.
“It only tells a partial story,” she tells PF.
“The outsourced council workforce – largely made up of low-paid, women workers – is not included in reports, which therefore underestimate the real gender pay gap. Neither is the gender pay gap between full-time and part-time workers identified. Since most part-time workers are women, this is a weakness.”
At the New Local Government Network, deputy director Jessica Studdert counters: “Collecting gender pay gap data in local government is a useful exercise as it aids transparency, captures a baseline, allows authorities to benchmark their performance against their peers and track their progress.”

A close examination of the two upper earnings quartiles reveals that women take the majority (54.6%) of positions in the middle upper earnings quartile across authorities. However, this position is not sustained in the upper quartile, where the sector average drops to 47.7% and men dominate.
“It’s striking that women are well represented in the upper middle quartile of earners across many authority types including counties, unitaries, mets, districts and London boroughs, but this tends to drop off in the upper earning quartile,” Studdert says.
“This suggests there could be an issue with women progressing to the most senior roles within local government, so highlights a possible area of focus for the future for development.”

The gender pay gap data was collated and analysed by Ben Seears and Mercy Nodarse of CIPFA’s analytics and research team.
The data set and analysis tool can be found at www.cipfa.org/ cipfa-thinks/cipfa-thinks-articles/gender-pay-gap-benchmarking.
The data is from the gender pay gap website. CIPFA has not verified the data with individual authorities.