Quick wins
Not for turning: seven in ten people oppose unilateral nuclear disarmament for the UK, while 24% support it, according to Ipsos Mori. Exactly the same split was recorded in 1987.
Up and away: UK public sector net debt (excluding banks) at the end of 2015 was just under £1,543bn, or 81% of GPD; an increase of £53.2bn over 2014’s figure.
Sliding scale: the UK raised £43bn in corporate tax in 2014/15 – 2.4% of national income. This is slightly below the OECD average, the IFS notes, having fallen since the downturn.
Pants on fire
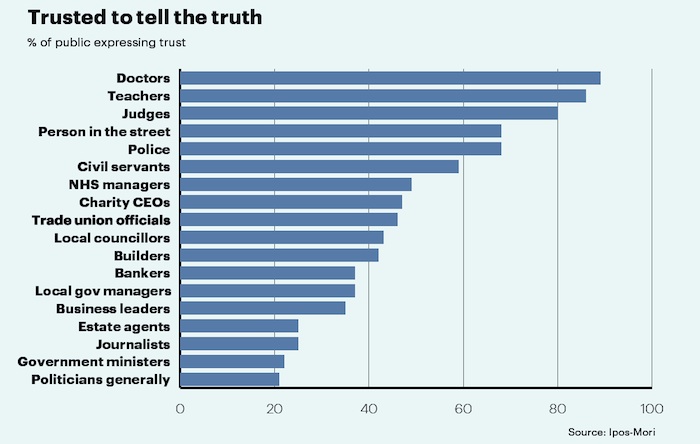
Most public servants are fibbers and phonies, if recent research from Ipsos Mori can be believed. The British public told the polling company that builders and estate agents are more trusted to tell the truth than government ministers and other politicians, while doctors are pegged as vastly more trustworthy than NHS managers. Trade union officials are seen as more reliable than local government managers, and even a random stranger in the street is expected to provide more honesty than a civil servant or charity CEO.
You might want to take this information with a pinch of salt, however, given that the above data was collected by pollsters – trusted by only 53%.
Charitable trust
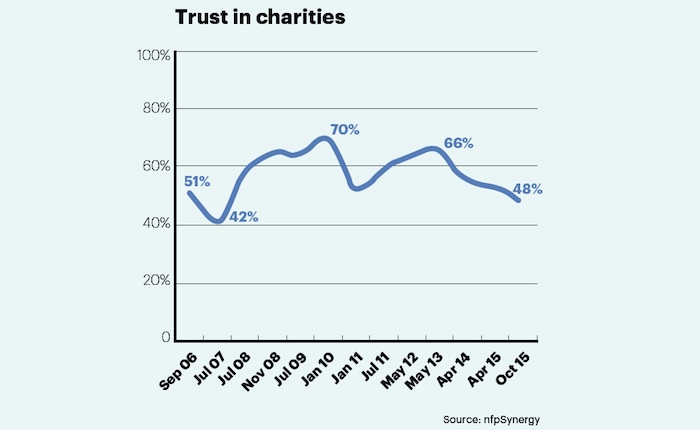
Research published in the autumn by third-sector research consultancy nfpSynergy shows how volatile public confidence in charities has been over the past decade. Trust had dipped to a nine-year low, but polling was done just prior to the high-profile closure of Kids Company, which will surely have carried sentiment below the 42% low tidemark of summer 2007.
However, as nfpSynergy notes, trust seems to recover fairly rapidly after this kind of knock.
States switch
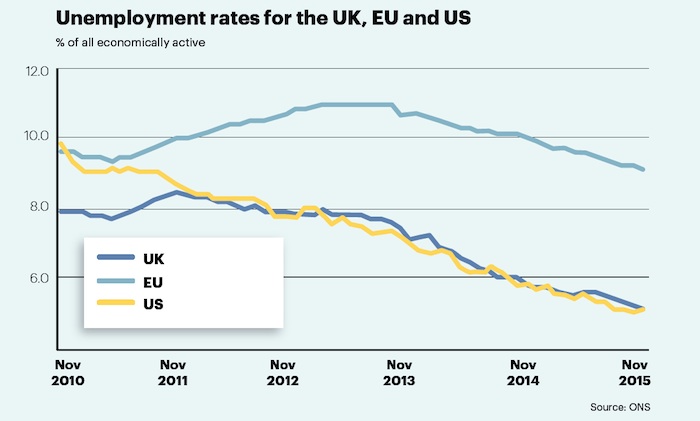
Unemployment figures show a distinct change of pace for the UK, around November 2011. From the downturn in 2008 up to that point, changes to unemployment in the UK roughly mirrored those in the EU as a whole, rising and falling in tandem, with the UK rate a couple of points lower.
From November 2011, the UK stopped tracking the EU and started matching the US, which has seen steadily falling unemployment since 2010.
Of course chancellor George Osborne famously eased off on austerity at around the same time, in the 2011 Autumn Statement. Cause or coincidence?
In the middle
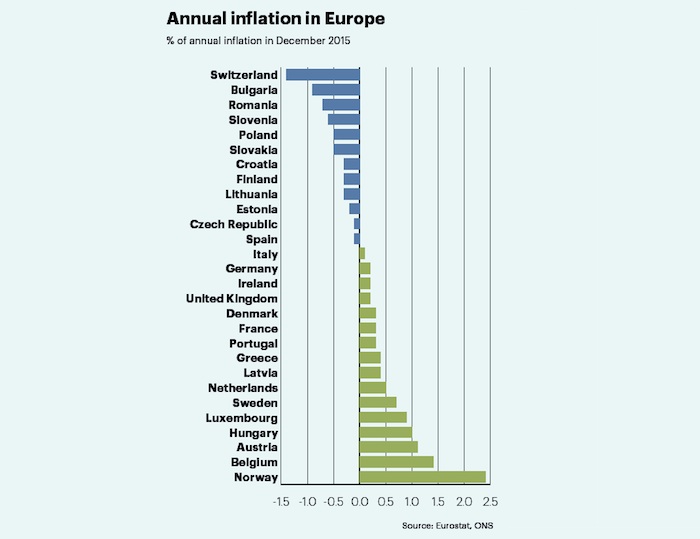
Inflation in the UK may be falling stubbornly short of the Bank of England’s 2% target, but the outcome in December 2015 – CPI growth of 0.2% – exactly matched the average across the EU. Indeed the UK’s domestic inflation and that of the EU overall have differed by no more than 0.1% since July.
This middling result is not because everyone in Europe is in the same boat. There was quite a big spread within the EU last month, from inflation of 1.4% in Belgium to deflation at -0.9% in Bulgaria, according to Eurostat figures.
Europe’s largest economies outside the EU bookend the distribution. Norway’s inflation rate was 2.4% in December, down from 2.7% a month earlier. Switzerland, by contrast, saw price growth dip to -1.4%, following four months at -1.2%.
Reader’s digest
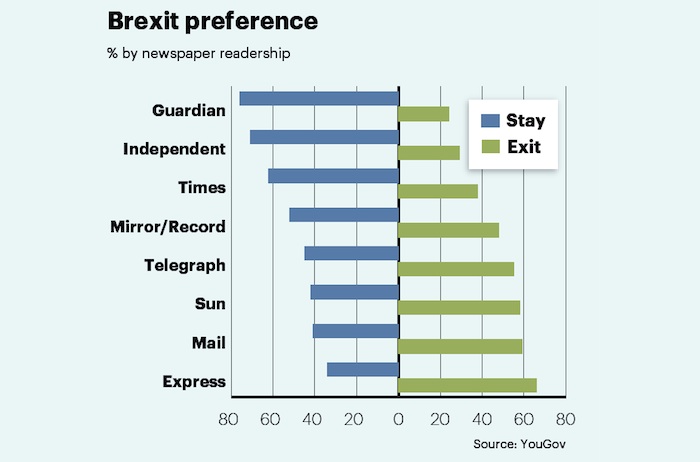
Newspaper circulations aren’t what they used to be, but they continue to span a wide range of political leanings. YouGov recently asked 22,000 British people how they plan to vote in the EU referendum. Guardian and Independent readers are, perhaps predictably, much more likely to back Europe than readers of The Sun, Daily Mail or Daily Express.
As YouGov notes, if each paper were to endorse the position of its readers, then Rupert Murdoch’s News UK would have to back both sides of the debate. That seems unlikely, though the media mogul may hedge his bets, so that at least one of his front pages can claim victory.
Housebuilding up (and down)
Figures from the National House Building Council show that 156,140 new homes were built in 2015. The tally marks a 6.7% increase over the total for 2014 and a whopping 75% more than in 2009, when house-building collapsed in the wake of the credit crunch.
The public sector accounted for 37,529 new-builds in 2015, representing 24% of the total for the year. Compared with 2014, public sector house-building grew by 5.2%, while the private sector showed 7.2% growth.
The strongest levels of expansion were seen in Northern Ireland (+30%, from a low base) as well as in the East (+23%), North West (+16%) and in Scotland (+15%). Regions where fewer homes were built in 2015 include Yorkshire and the Humber (-13%) and Wales (-2%).
The number of new homes built in London also fell, declining by almost 9%, albeit from a record high in 2014. With almost 26,000 new builds in 2015, London accounted for one in six houses built last year.


