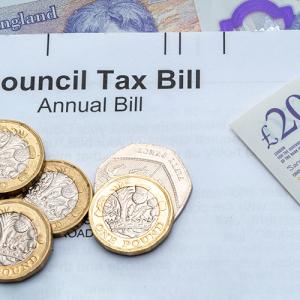
The institute’s annual council tax survey found many councils are set to increase council tax by up to the maximum 3.99% allowed – made up by the 2% precept for social care authorities and the 1.99% increase allowed under the government’s referendum cap.
The average increase outside the capital will be 3.6%, adding £54 to the average Band D bill.
However, Greater London council tax payers will see an average increase of just £8.04 on a Band D property. This is mainly due to a reduction in the council tax precept by the Greater London Authority. If this is excluded, the average Band D bill for London would have seen an increase of 2.7%, which still less than the rest of the country.
The poll, which is based on 314 responses to questionnaires sent to 420 authorities in England and Wales, found there would be the highest increase in council tax since 2008, which CIPFA said reflects changes being made to revenue support grant.
2016/17 is also the first year since 2011/12 the government has not offered a grant to local authorities to freeze rates and of the 314 respondents, 283 will be increasing their council tax
CIPFA chief executive Rob Whiteman said councils had made by far the biggest efficiencies in the public sector and, as a result of government incentives over the last Parliament, council tax rates had remained relatively static.
“But things have changed,” he stated. “Councils are effectively being encouraged by government to raise council tax, which marks a contrast to its stance in previous years.
“Over the next four years, government will be making fundamental changes to how councils are funded, essentially withdrawing Whitehall grants by allowing councils to keep more local business rates. This is a very positive move for local democracy, but there must be clarity on the detail of the new system to show how relatively less well-resourced authorities will fare.”
Office of Budget Responsibility projections at the 2015 Spending Review forecast council tax would rise by 3.8% annually over the next four years, potentially adding £181 to the average Band D bill in England by 2020.
The survey also found that almost all of the money-raising potential of the social care precept would be used by local government. CIPFA’s analysis found the precept would raise £385.2m out of a total possible £394.3m in 2016/17, amounting 97.7% of the possible yield.
Responding to the survey, communities secretary Greg Clark said the government’s four-year funding deal for councils both gave them certainty to plan ahead, and had met a clear request to prioritise care for our elderly population.
“It means councils have the freedom to set a social care precept as part of local bills, with excessive council tax increases still subject to local referendum to protect council taxpayers,” he added.
“Even with these changes council tax will still be lower in real terms in 2019/20 than in 2009/10 – and this year’s increase will still be lower than the average 6.2% annual increase between 1997 and 2010.”
COUNCIL TAX INCREASES | Average Band D Equivalent | |||
| (including Parish / Community) | |||
|
| Percentage | Total | |
|
| Increase / | Increase / | |
2015/16 | 2016/17 | (Decrease) | (Decrease) | |
| £ p | £ p |
| £ p |
|
|
|
|
|
Inner London | 1,095.53 | 1,100.49 | 0.5% | 4.96 |
Outer London | 1,424.78 | 1,436.09 | 0.8% | 11.31 |
Greater London | 1,298.32 | 1,306.36 | 0.6% | 8.04 |
Metropolitan Districts | 1,451.29 | 1,506.20 | 3.8% | 54.91 |
Unitary Authorities | 1,518.39 | 1,572.54 | 3.6% | 54.15 |
Other Non-Metropolitan Authorities | 1,547.18 | 1,600.87 | 3.5% | 53.69 |
England (excluding London) | 1,519.67 | 1,573.68 | 3.6% | 54.01 |
All England | 1,483.59 | 1,529.52 | 3.1% | 45.93 |
South East (excluding London) | 1,528.21 | 1,582.94 | 3.6% | 54.73 |
Greater London | 1,298.32 | 1,306.36 | 0.6% | 8.04 |
East of England | 1,519.94 | 1,568.05 | 3.2% | 48.11 |
East Midlands | 1,551.52 | 1,606.70 | 3.6% | 55.18 |
North East | 1,578.55 | 1,638.17 | 3.8% | 59.62 |
North West | 1,519.55 | 1,573.64 | 3.6% | 54.09 |
South West | 1,547.45 | 1,605.56 | 3.8% | 58.11 |
West Midlands | 1,466.20 | 1,518.90 | 3.6% | 52.70 |
Yorkshire & the Humber | 1,468.68 | 1,521.77 | 3.6% | 53.09 |