Waiting in line
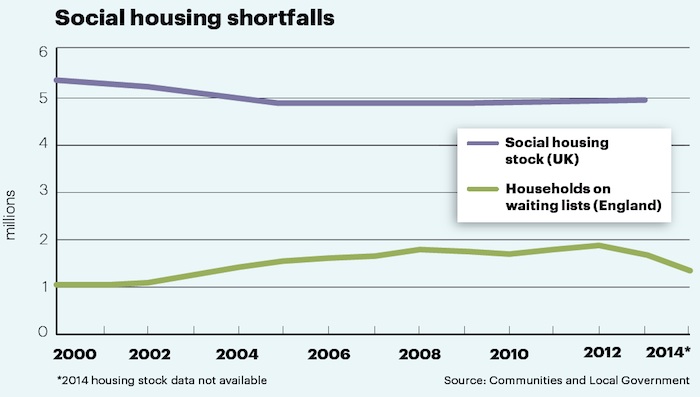
The overall number of households on waiting lists for social housing in England increased steadily from 2000 to 2012, peaking at 1.85 million households. Over the following two years, the number of families waiting for social housing decreased considerably, standing at 1.37 million in 2014. An improving economy may lie behind the reduction, though the Office for National Statistics also speculates that changes in the way waiting lists are compiled may also have a bearing.
The introduction of “affordable” rented housing in 2011 made only a small dent in the waiting lists. Around 27,650 families moved into affordable rented properties after its introduction, accounting for less than 6% of the reduction seen in the figures after 2012.
The number of families waiting for a home in England still represented a very significant fraction of the UK’s total social housing stock in 2014. The total number of homes fell below five million in 2004 and did not recover over the subsequent decade.
Only three local authorities in England had no waiting list at all in 2014. Medway had the largest relative shortfall, with a waiting list 2.4 times greater than its entire social housing stock.
Right to rebound
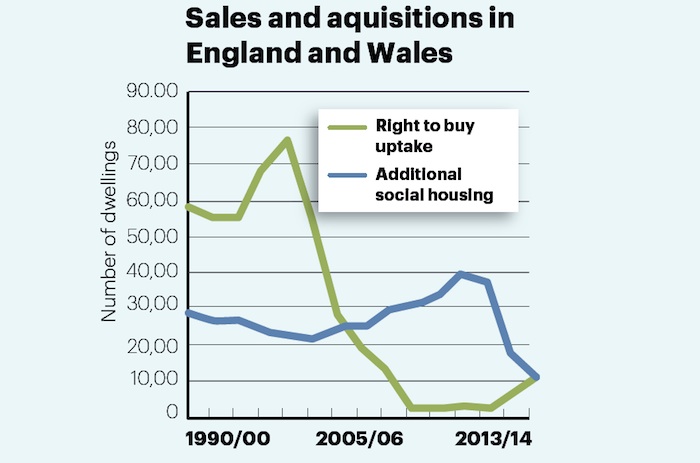
Between 1999 and 2014, there were 457,757 sales of social housing in England and Wales under the government’s Right-to-Buy scheme. There has been little sign of any correlation between recorded sales and the building or acquisition of replacement properties. Over the same period, 398,170 social homes were added to the stock, either as new builds or through the acquisition of existing housing.
Changes in the rules in 2005 precipitated a collapse in Right-to-Buy sales figures, while an increase in the level of subsidy in 2011 triggered a modest resurgence in uptake
Easing the squeeze
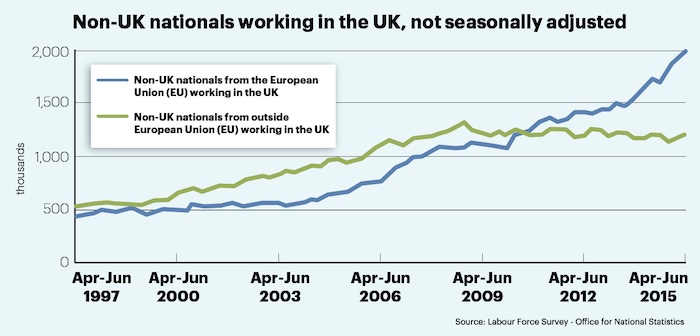
The number of foreign nationals from outside the EU working in the UK has drifted slowly downward since 2009, while the number of European migrants has increased steadily to reach around two million in the second quarter of 2015, from a total of 3.18 million foreign employees.
In total, there were just over 31 million people in work in the second quarter, and a calculator is probably not needed to conclude that foreign nationals make up around 10% of the UK workforce.
The overall UK workforce fell by 63,000 compared with the first quarter of 2015 but stood 354,000 higher than a year earlier in the second quarter.
Public sector employment continues to fall, driven in part by privatisation. In March 2015 the figure stood at 5.73 million employees, 17.3% of the UK total.
Stoppage time
A total of 788,000 working days were lost due to labour disputes in 2014, compared with 444,000 in 2013. The increase was primarily a result of large-scale public sector strikes. The majority of individual strikes occurred in the education industry.
For the 12 months ending June 2015, there were 670,000 working days lost from 156 separate stoppages.


