Quick wins
Warming up: February 2016 was the warmest February the world has seen since global record-keeping began in 1880. The scale of the rise above average temperatures, 1.35˚C, was also the biggest jump for any month yet recorded.
Increased zeroes: Some 801,000 people were working under zero-hours contracts in November 2015, according to ONS figures. This is 2.5% of employed UK workers, up from 2.3% a year earlier.
Suck it and see: Polling by Populus in November 2015 found that 41% of adults in the UK thought a sugar tax on soft drinks would be effective in tackling obesity. Exactly the same proportion – 41% – felt it would be ineffective.
Central attraction
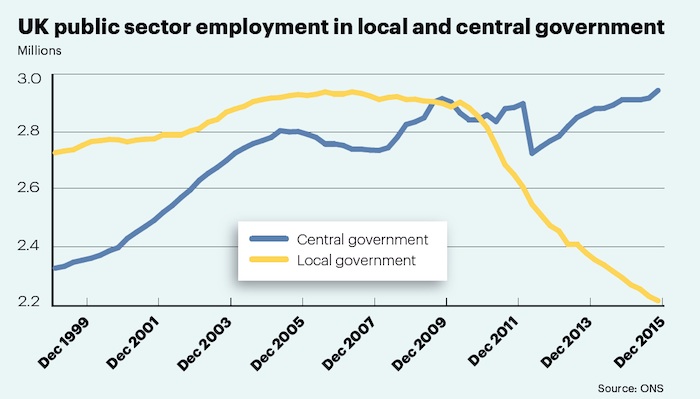
Local government employment has been in steep decline since June 2010, with ONS figures for December 2015 recording a loss of 79,000 posts (3.4% of employees) compared with a year earlier. The end of year headcount stood at 2.23 million, 710,000 down on June 2007’s peak. Employment via central government, by contrast, increased by 32,000 (1.1%) during the year to reach 2.95 million.
The opposing trends have been amplified by changes in classification. Academies are centrally funded, for example, whereas local authority maintained schools sit within local government. Last year, 40,000 people switched from local to central as a result of academy conversions, accounting for roughly half of the losses in local government.
The sudden drop in central headcount, in mid-2012, came about as 196,000 staff at English further education and sixth form colleges moved into the private sector.
No accolade for academies
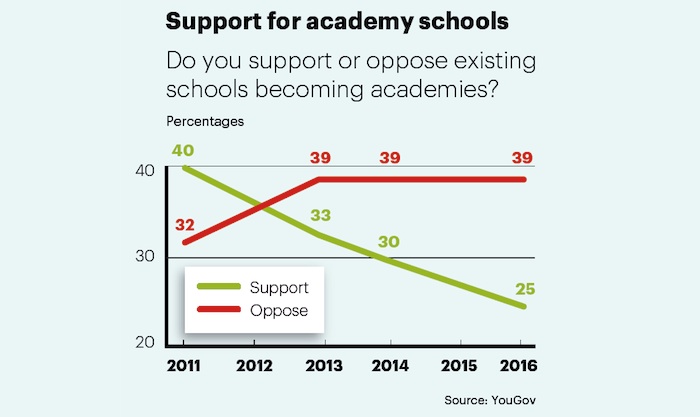
March’s Budget included a £1.5bn plan to convert all state schools into academies by 2022, a move that runs counter to public opinion, according to YouGov polling. The proportion of people opposed to academies has held steady at 39% since 2013, but the number in favour has fallen from 33% to 25% over the past three years.
Almost half (48%) of teachers polled said creating more academies would make educational standards worse, while only 17% felt this would improve outcomes.
Distrust fund
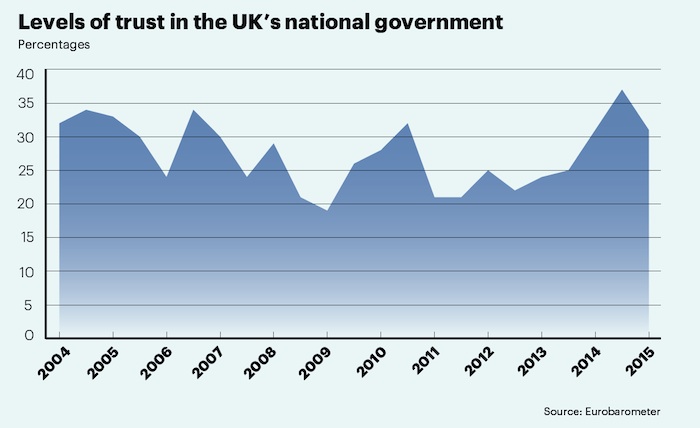
British people’s trust in the government reached a 10-year peak in the spring of 2015. Presumably influenced by campaigning around the general election, 37% of those polled – aged 15 or over – said they “tended to trust” the government. Sentiment quickly slipped back down again, with only 31% still tending towards trust by the autumn.
Trust hit a low of 19% in the autumn of 2009, doubtless fuelled by the financial crisis and the MPs’ expenses scandal.
As of the autumn, 64% of people said they tended not to trust the UK government, very close to the average across the EU. In Greece, Spain, Slovenia and Portugal, around 80% don’t trust their government.
Exit opinions
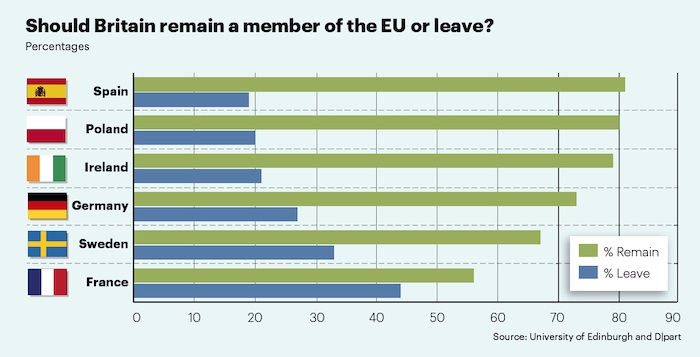
A study published by the University of Edinburgh and German think-tank D|part has found a majority of people in each of six European countries think the UK ought to remain part of the EU.
Sentiment was plumbed in January and early February, and was in very rough agreement with an ICM international poll from November last year. ICM also polled people in Norway – outside the EU – where 34% favoured a British exit, 27% said the UK should stay put and 39% didn’t know (or perhaps care).
The more recent study also found a majority of citizens in France (53%) would like to see their own national exit referendum, versus 29% against such a vote and 15% undecided. While falling short of a majority, those in favour of holding an exit referendum outnumbered those opposed to the idea in Germany, Spain and Sweden.
Qualified success
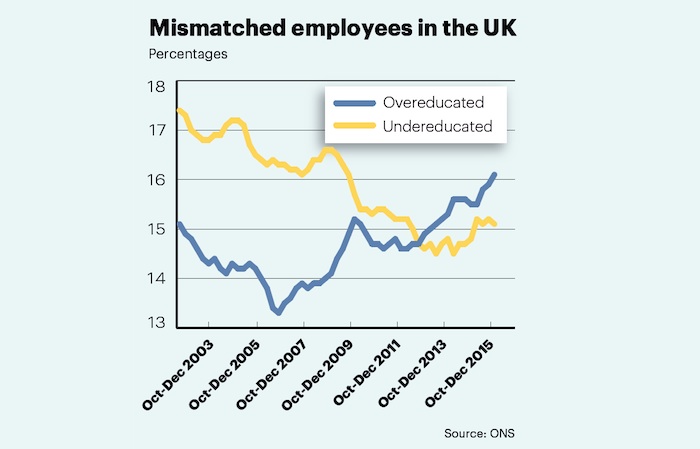
The majority of UK employees are thought to be in jobs that “match” their educational background – their level of education is close to the average for their occupation.
A 2012 study estimated that 28.9% of UK staff were in jobs not suited to their skill level – with 15.0% educated well above the average for their occupation (overeducated), and 13.9% with an academic record markedly below their peers’ (undereducated). Out of 24 countries, the UK had the fifth highest level of mismatch at the time.
The latest ONS figures show 16.1% are now overqualified and 15.1% underqualified for their roles – accounting for almost a third of UK workers.
City region productivity
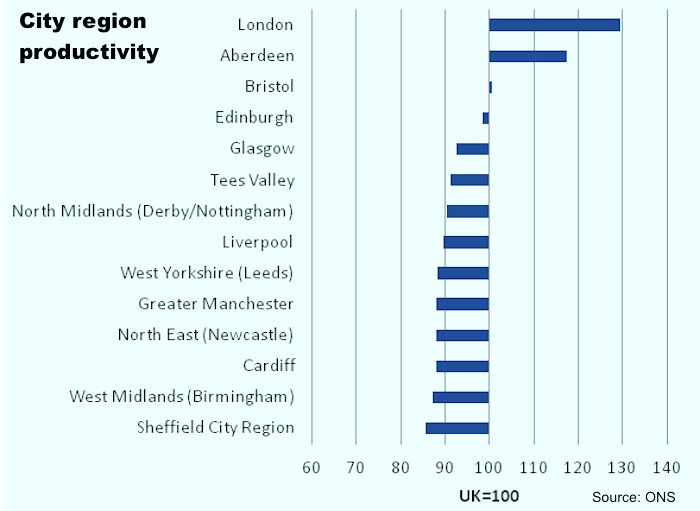
New figures from the ONS show the relative productivity of the UK’s city regions, using economic data from 2014.
The ONS notes that no consistent definition of a city region exists, so it has chosen boundaries used to define existing devolution agreements, city deals and combined authorities as well as groupings proposed for future devolution deals.
Greater London was the top performer in 2014, with output 30% above the UK average for gross value added per hour worked. Aberdeen was 17% above average, while Bristol and Edinburgh city regions saw productivity close to the UK average.
Arguably underscoring the need for the Northern Powerhouse plan, city regions in the North of England and in the Midlands had outputs of between 7% and 14% below the UK average.


